Infographics
-
Path to Recovery
Make your way through this map of the Endangered Species Act, and learn about the petitioned, listed, and recovered species in Wyoming. Created in collaboration with Wyoming Natural Diversity Database Director Gary Beauvais for Western Confluence magazine.
-
Energy in the West
As markets, demands, and policies change, the energy mix, both in the West and on a national scale, will continue to shift in the coming years. How exactly energy resources will fall onto the map remains to be seen. View…
-
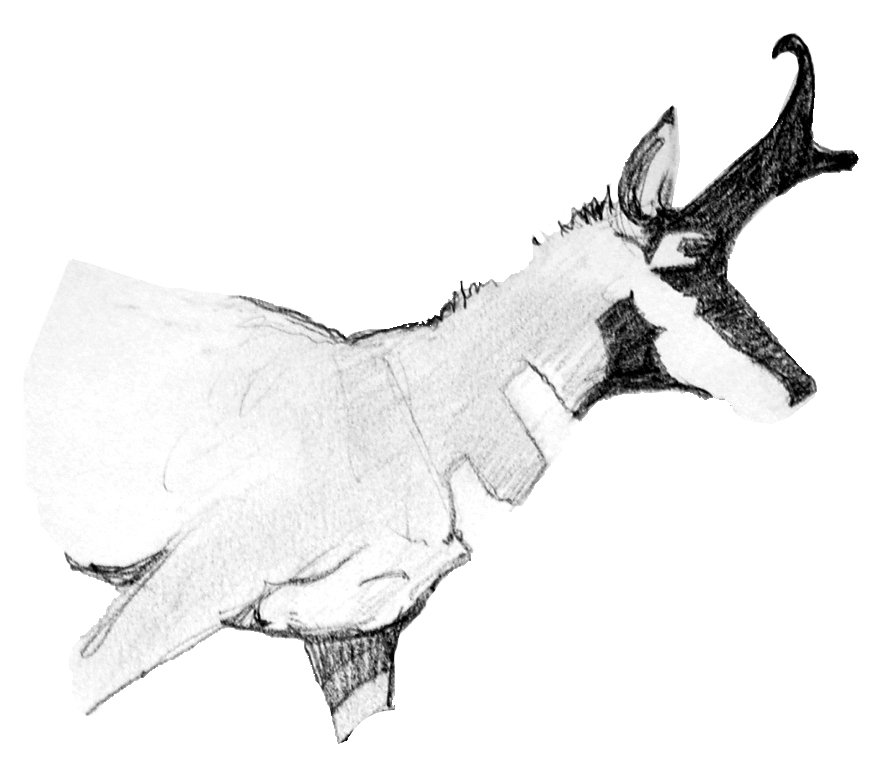
Critter contraceptives
Scientists are working on effective birth control methods for wild animals. See Shaun Gibson’s illustrations and read about it at High Country News.
-
Draining the tub
As the Lake Mead water level drops below historic record lows, the future of the reservoir does not look good. See a graph of water levels and read the story at High Country News.
-
Beyond beefalo
Bison recovery efforts are compromised by DNA contamination from 100+ years of crossbreeding with cattle. See the map, photo and cutline at High Country News.
-
Welcome back, otter
Following introductions to several waterways in Colordao, river otter populations recover. Read the story and see a map at High Country News.
